The Database
The database is a core element of the International Inventories Programme. Since 2019, IIP has been contacting museums around the world to share their data of the Kenyan cultural heritage in their collections to build a database of Kenyan objects held in the "Global North." It will serve as a tool to make Kenyas heritage accessible for researchers and stakeholders globally and allow Kenyan communities to quickly locate their cultural heritage.
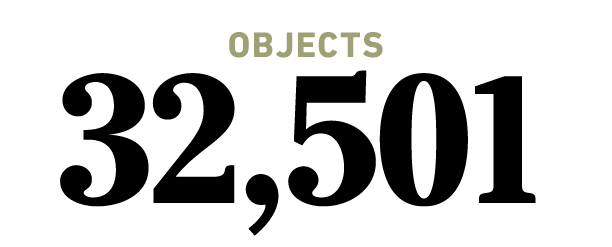
Currently, the database includes over 32,000 historic Kenyan cultural objects from thirty institutions worldwide. Almost 7,000 objects from nine museum collections are now published online and over the coming weeks, we will continuously publish more data until all of it is available for everyone.
A problem with this data is the common mislabeling of objects, especially regarding their cultural origin. Cultural groups are often misspelled and sometimes referred to by derogative terms. In the published data we have corrected misspellings and clearly marked derogative language. We do apologize for any oversights that might have occurred in this.
We are working very hard to make this data as accessible as possible through added explanations, historical context and corrections of mislabeled objects in the original data. We are excited for your feedback in this endeavor. If you find any mistakes or have any questions or ideas you want to share with us – please, get in touch!
Current Object Statistics (11th November 2020):
A Collective Outlook
“The idea of Kenyan objects abroad becomes very real when the numbers of these objects, alongside attendant details, become publicly accessible data. Putting all of this currently scattered and disaggregated information into one document is an ongoing digital effort that mirrors the physical aim of restitution and reparation movements: to gather them and bring those that need to be returned, back home.”
An introductory essay by The Nest Collective that examines the stories behind the data, its implications and the questions that arise from it. Read the full essay here!
How to use the Database:
You can display and analyze the data in many different ways using the functions provided by the programme. As they are not always entirely self-explanatory, we have tried to explain the most basic functions.
TOOLS:
There are three different tools:
Filter: It allows you to only look at data that has a certain property in common. For example, you can choose to only display objects collected by the same person or belonging to a specific cultural group.
Group: With this function the programme sorts the objects into groups of you choosing. You could for example have all objects located in the same country grouped together, to compare the collections held in various nations.
Sort: The objects will be displayed in a certain order based on the category you choose. Try displaying them chronologically, based on the year of their acquisition, to see the development of collecting practices in Kenya and compare before and after independence.
You can also combine these tools in interesting ways. As an example, you could filter for a specific collector and then sort chronologically, to see how their collection evolved and their interests changed.
Views:
There are two different views available:
The Gallery view shows the objects displayed as cards, with a large image and only a selection of the information displayed. As it shows less information and allows for less tools to be used, it is less useful for researchers, but good to give you a first impression of the objects. You can click the cards to see more.
The Grid view displays all the available data similarly to an Excel Sheet. It can be slightly overwhelming, but is extremely useful when you want to look at more than one object or compare different datasets.
Bringing the Data to Life
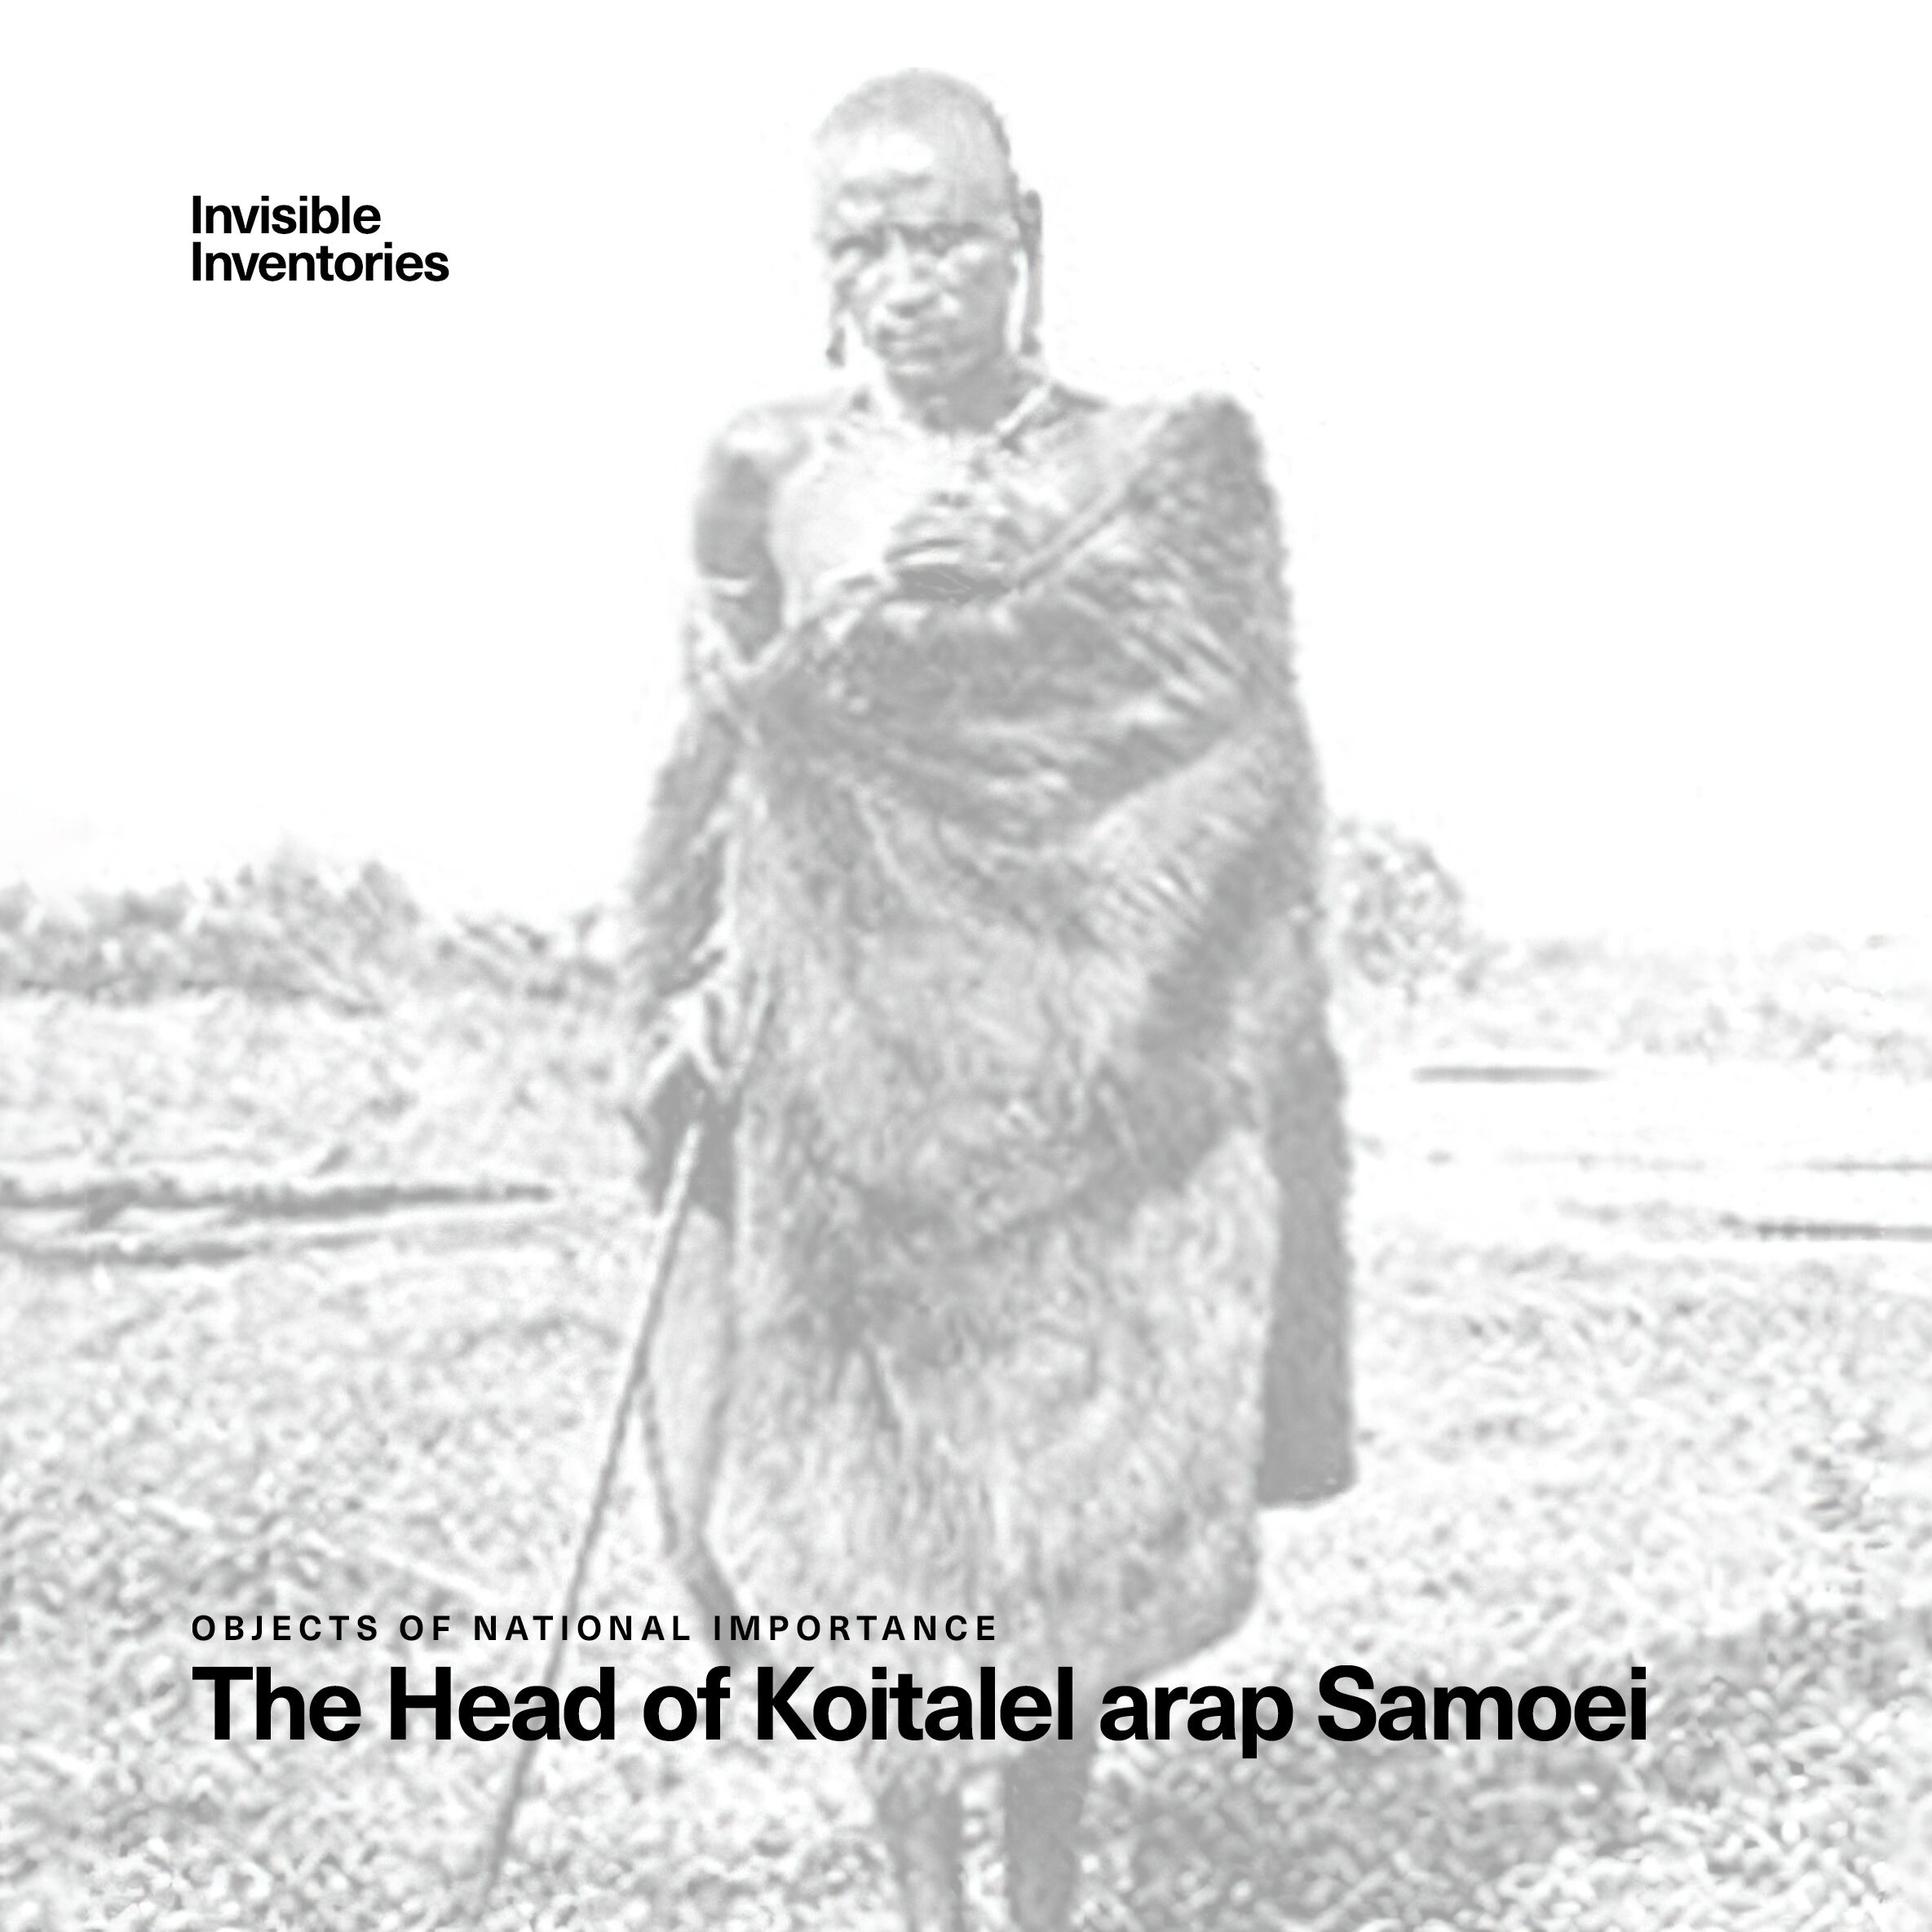
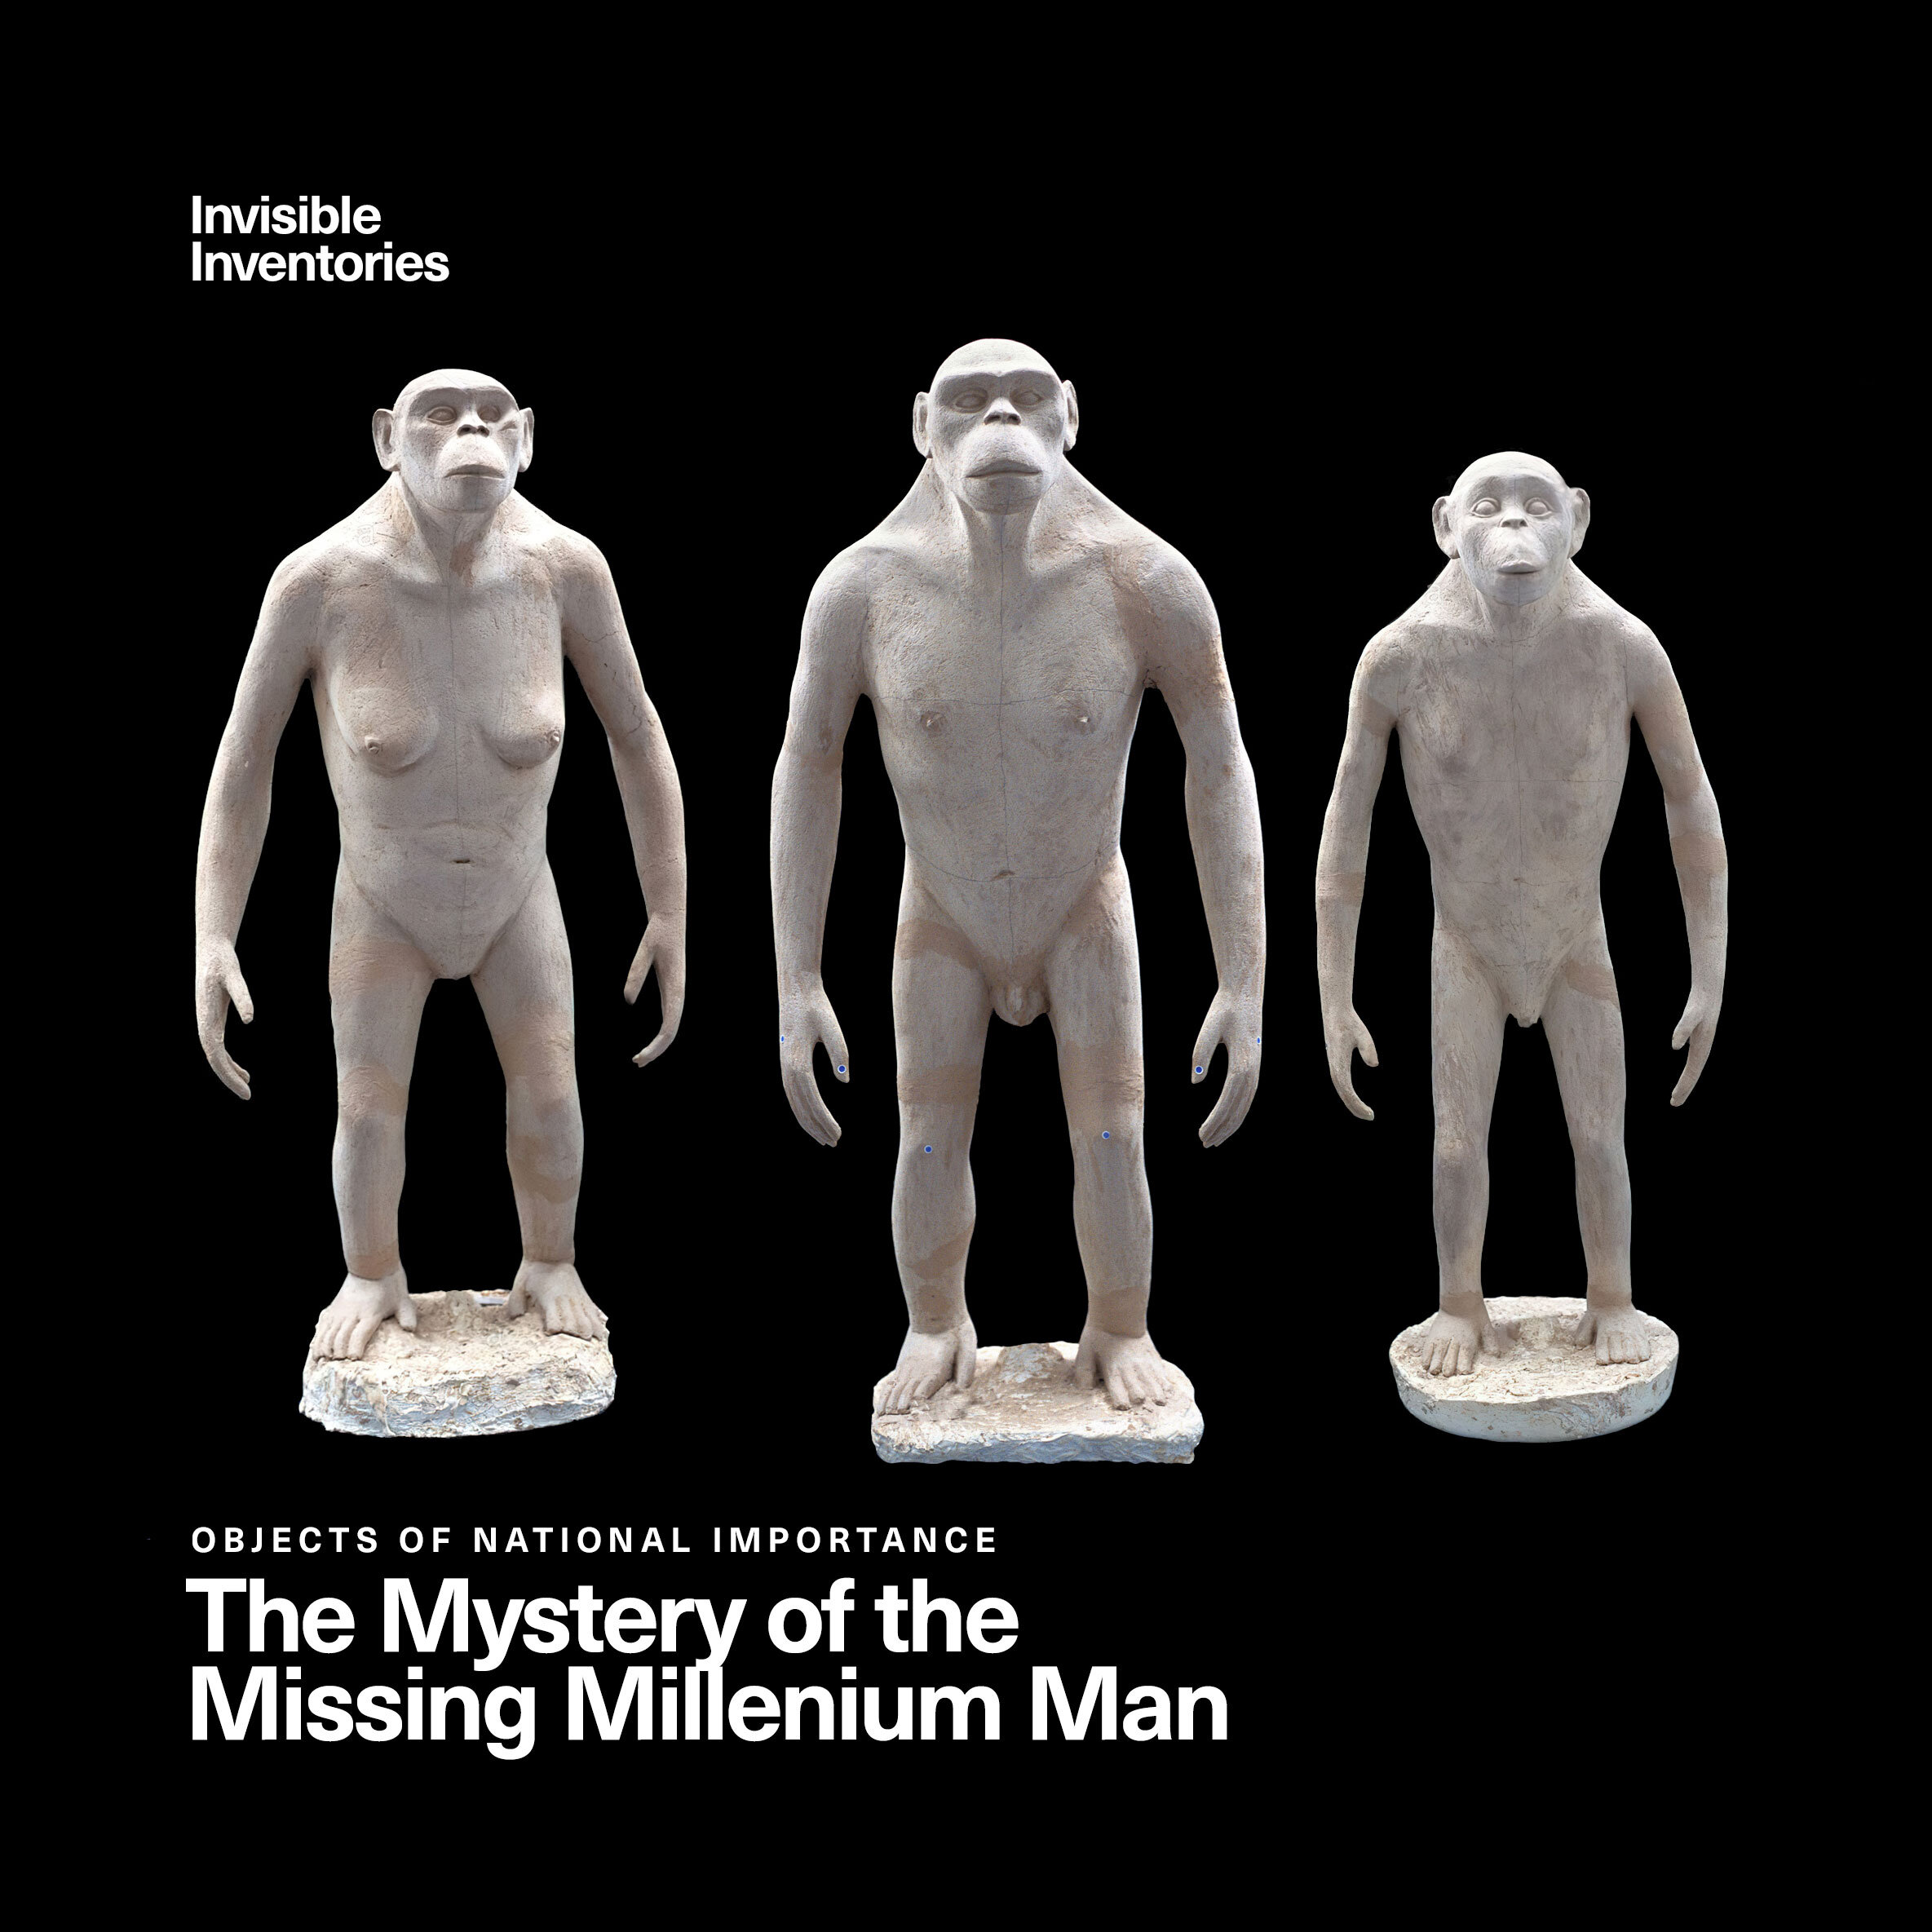
In a row of conversations Dr. Njoki Ngumi and Jim Chuchu of the Nest Collective bring the stories behind these objects to life. Some of the topics covered are objects of national importance, collectors bios and an in depth discussion of the question: what are our objects worth? You can listen to all of their conversations here.
Charting the Data
The Nest Collective has created several charts visualizing different aspects of the data.
Contributing Institutions
These are the institutions that have shared their data with us so far. Those whose data is published already have been highlighted.
American Museum of Natural History, New York, USA
British Museum, London, UK
Brooklyn Museum, New York, USA
Ethnologisches Museum SMB, Berlin, Germany
Field Museum, Chicago, USA
Glasgow Museums, Glasgow, UK
GRASSI Museum für Völkerkunde zu Leipzig, Leipzig, Germany
Horniman Museum and Gardens, London, UK
Landesmuseum Hannover, Hannover, Germany
Linden Museum, Stuttgart, Germany
Museo delle Culture di Milano (MUDEC), Milan, Italy
Museo delle Civiltà, Rome, Italy
Museum Fünf Kontinente, Munich, Germany
Museum für Völkerkunde Dresden (MVD), Dresden, Germany
Museum Natur und Mensch, Freiburg im Breisgau, Germany
Museum of Liverpool, Liverpool, UK
Penn Museum, Philadelphia, USA
Pitt Rivers Museum, Oxford, UK
Musée du Quai Branly - Jacques Chirac, Paris, France
Rautenstrauch-Joest Museum, Cologne, Germany
Royal Albert Memorial Museum and Art Gallery, Exeter, UK
Royal Museum for Central Africa (RMCA), Tervuren, Belgium
The Metropolitan Museum of Art, New York, USA
The Museum am Rothenbaum – Kulturen und Künste der Welt (MARKK), Hamburg, Germany
Victoria and Albert Museum, London, UK
Världskulturmuseet, Gothenburg, Sweden
Völkerkundesammlung der Hansestadt, Lübeck, Germany
Ethnographische Sammlung der Philipps-Universität Marburg, Marburg, Germany
Weltkulturen Museum, Frankfurt, Germany
Übersee-Museum Bremen, Bremen, Germany

